Ray Data: groupby and aggregate
Groups rows by a key and computes Count and Sum per group with Ray Data built-in aggregations.
When to use it. Per-key statistics over large tables: totals per customer, counts per category.
The picture below is the graph drawn in Eugo's visual Ray builder, and the cell under Generated code is the Ray code the builder produced from it. The code is plain Ray: it runs without the builder.
Back to the gallery · Tested with Ray 2.55.1
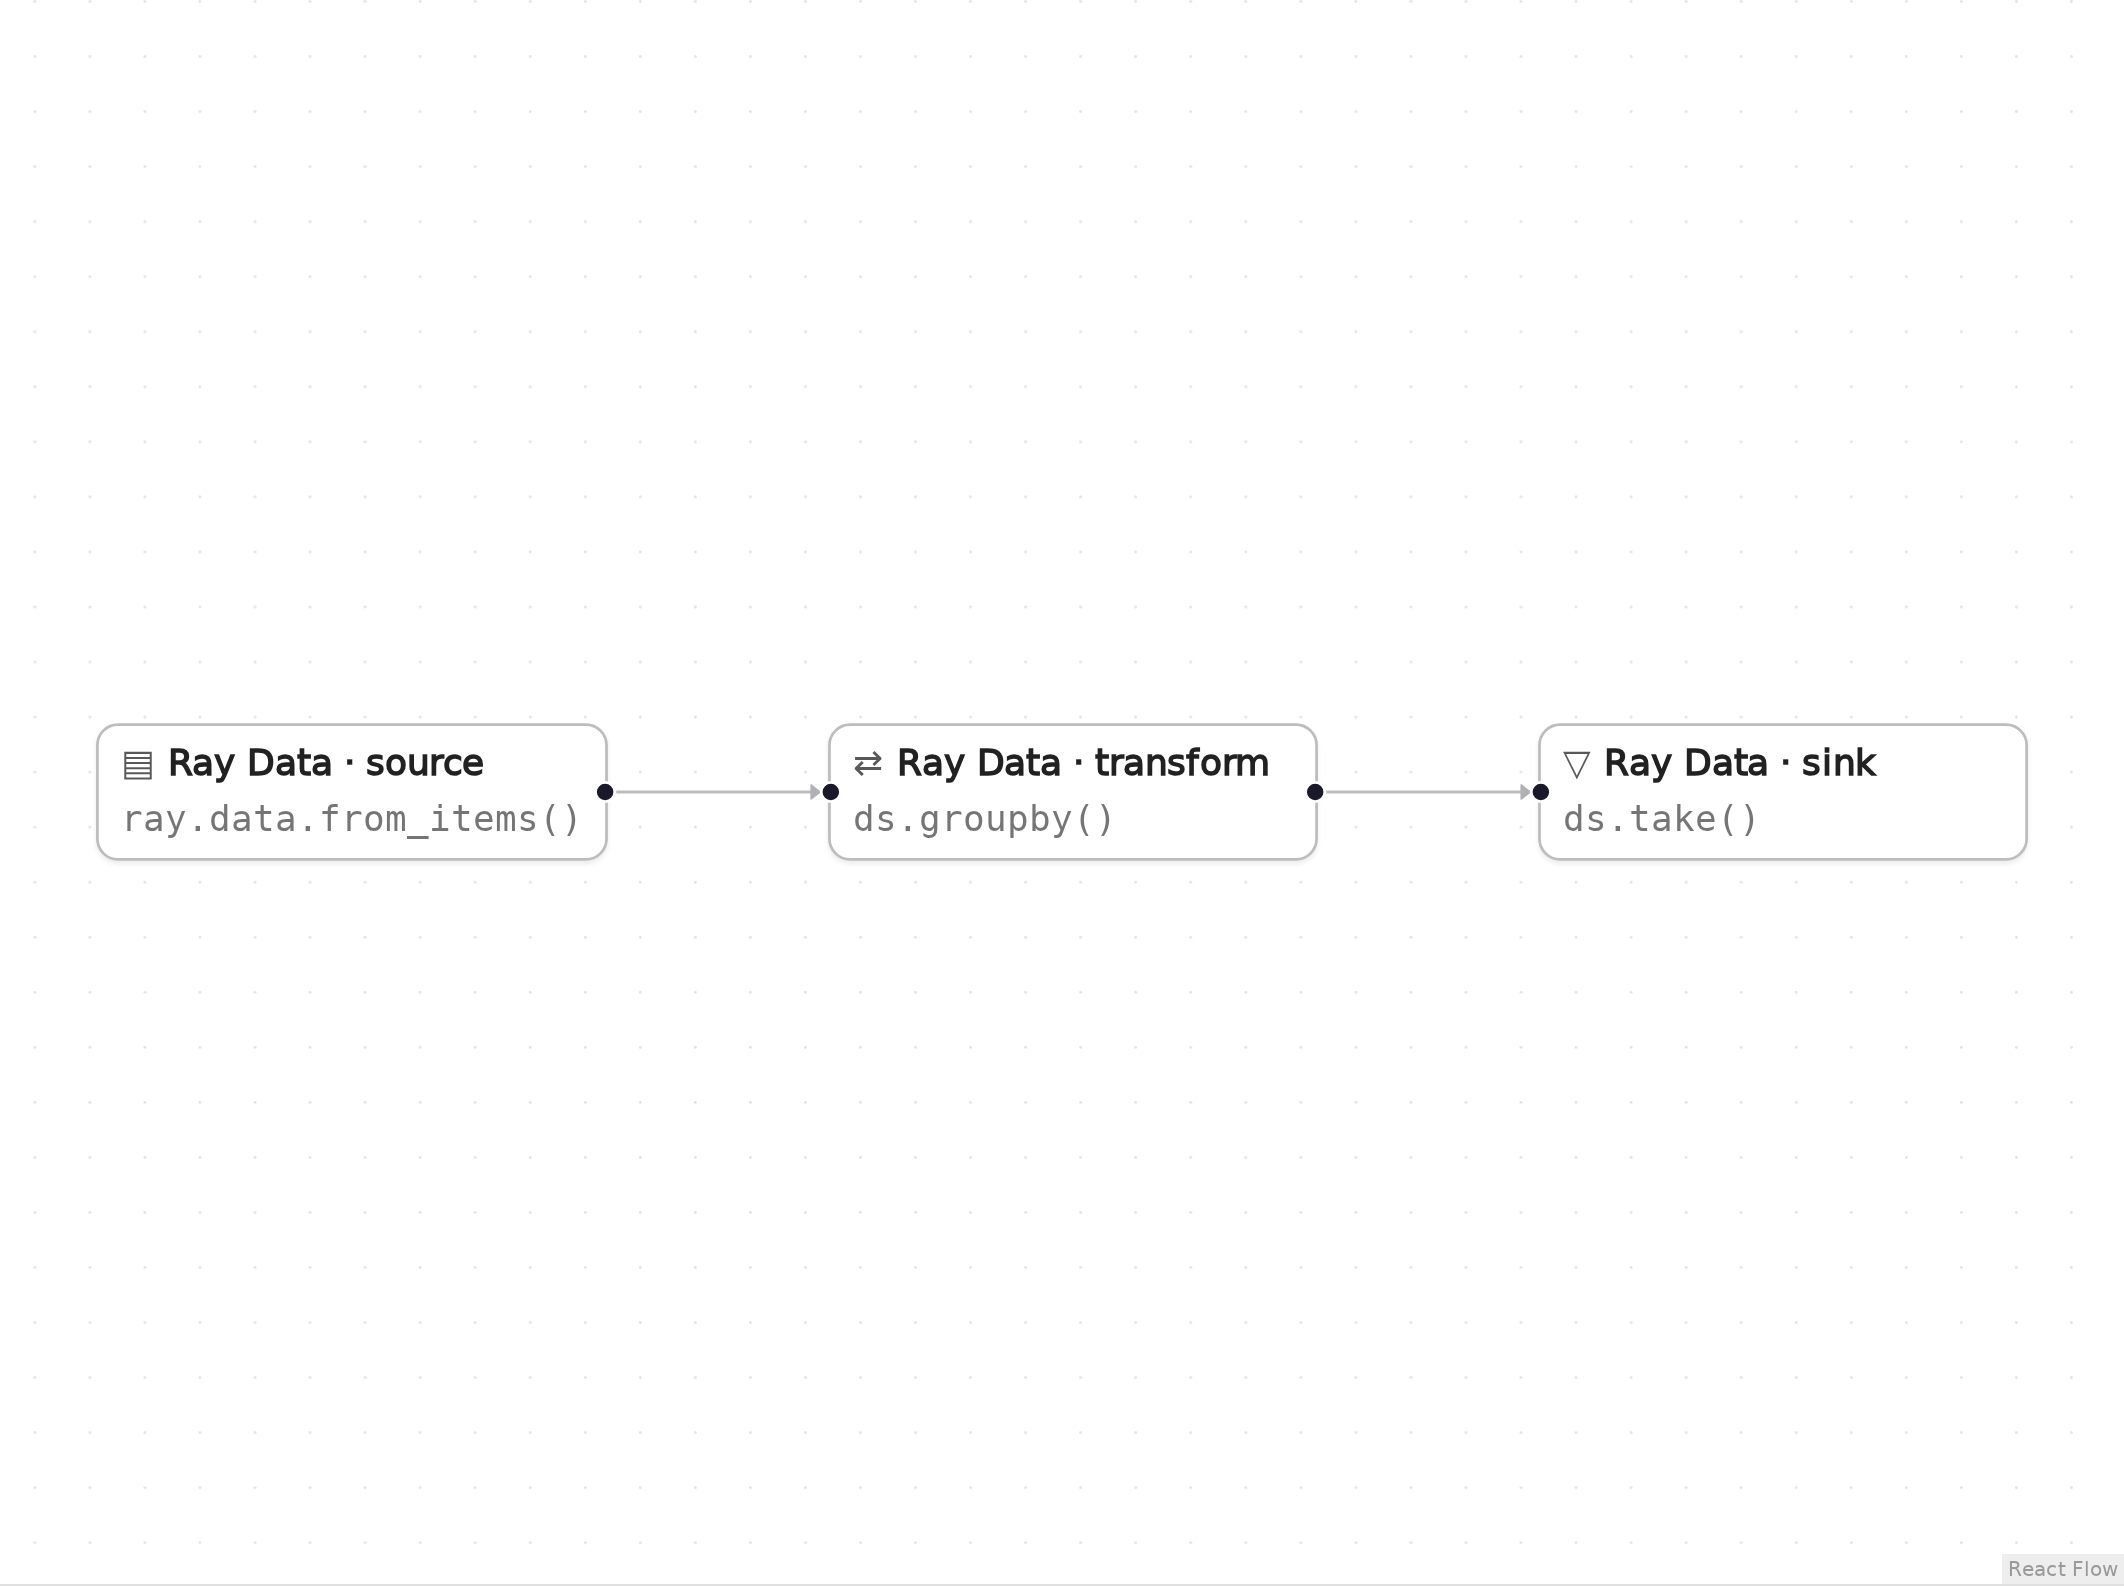
The graph in Eugo's visual Ray builder.
Setup
Start a local Ray instance. The options keep the notebook quiet: no dashboard, and worker logs stay out of the notebook. Ray is capped at four CPUs so the example behaves the same on any machine. The generated code below only calls ray.init() when Ray is not running yet, so it reuses this instance.
import ray
ray.init(include_dashboard=False, log_to_driver=False, logging_level="ERROR", num_cpus=4)
RayContext(dashboard_url='', python_version='3.12.3', ray_version='2.55.1', ray_commit='237c2455ebb1ea15a32dd9e1fdeb2d617badc37f')
User functions
This pattern needs no user functions: Count and Sum are Ray Data built-ins.
Generated code
This is the cell the visual builder generated from the graph above.
# Generated with Eugo's visual Ray builder

import ray
from ray.data.aggregate import Count, Sum

if not ray.is_initialized():
    ray.init()

ds = ray.data.from_items([{"g": "a", "v": 1}, {"g": "a", "v": 3}, {"g": "b", "v": 5}])
ds = ds.groupby("g").aggregate(Count(), Sum("v"))
agg = ds.take(5)
Check the result
The cell below checks that the generated code did what the graph describes.
by_group = {r["g"]: (r["count()"], r["sum(v)"]) for r in agg}
assert by_group == {"a": (2, 4), "b": (1, 5)}, by_group
print(by_group)
{'b': (1, 5), 'a': (2, 4)}
How the graph maps to the code
Each step names a node in the picture, the lines of the generated cell it produced, and what those lines do. The node id (for example n1) is also the suffix of the variable that holds the node's result.
Setup (lines 1, 3–4 and 6–7)
# Generated with Eugo's visual Ray builder
...
import ray
from ray.data.aggregate import Count, Sum
...
if not ray.is_initialized():
    ray.init()
The first line marks the cell as generated. The builder then adds an import for every Ray API the graph uses and a guarded ray.init(), so re-running the cell reuses the running cluster.
Source (node n1, line 9)
ds = ray.data.from_items([{"g": "a", "v": 1}, {"g": "a", "v": 3}, {"g": "b", "v": 5}])
from_items builds a small in-memory dataset.
Transform (node n2, line 10)
ds = ds.groupby("g").aggregate(Count(), Sum("v"))
groupby("g").aggregate(Count(), Sum("v")) shuffles rows by key and aggregates each group.
Sink (node n3, line 11)
agg = ds.take(5)
take(5) returns up to five result rows as dicts.
Clean up
Shut down Ray, so the next notebook starts fresh.
ray.shutdown()